
 School of Economics Director of Research, Professor Helen Simpson explores the local impacts of the Coronavirus pandemic on the economy.
Data from the Office for National Statistics (ONS) has shown very clearly that the impact of Covid-19 has not been felt equally in all areas of the country. Death rates are typically higher in more deprived areas, but these differences are even greater when looking at deaths due to Covid-19. This is most starkly illustrated in an ONS publication on age-adjusted death rates across areas according to their level of deprivation (all figures are relative to the least deprived areas, category 10 on the left). It looks likely that the pandemic will amplify existing geographic inequalities and it has certainly shone a very bright spotlight on them, with the health, economic, and likely educational effects hitting places unevenly.
Covid-19 mortality rate higher in more deprived areas and dense urban areas
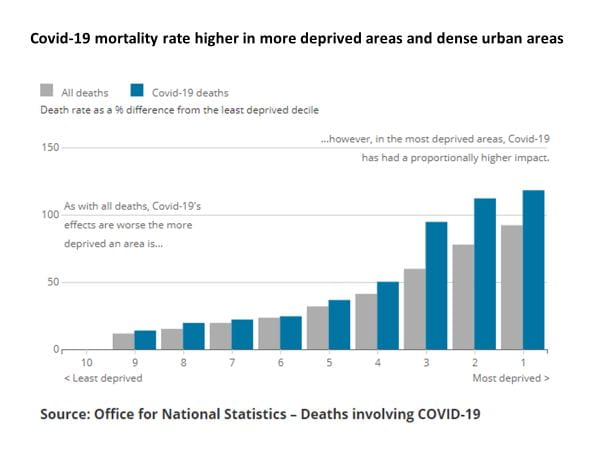
Source: Office for National Statistics – Deaths involving Covid-19
Geographic inequality
The variation in death rates reflects the fact that, before the pandemic, the UK already exhibited long-term differences in economic, education and health outcomes across areas. These disparities could be seen across regions (North versus South), within regions (comparing cities to more rural areas), and within cities (highly deprived neighbourhoods sitting close to highly affluent ones). They could also be seen in a range of measures such as productivity, wages, and unemployment rates.
One summary measure is the Index of Multiple Deprivation which combines a number of indicators including income, employment, education, health and housing. The map gives a picture of the intensity of deprivation according to this index across local authorities in England. There are clear concentrations in urban areas in the North and in coastal areas in the South, South West and East.
Intensity of deprivation across areas
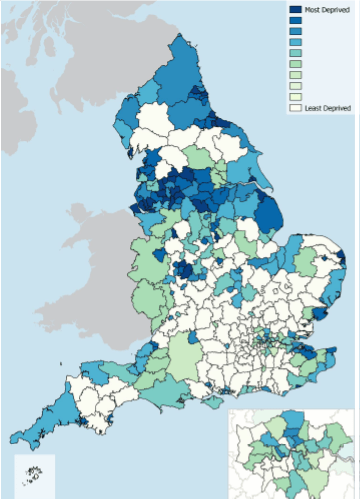
Note: Map shows fraction of neighbourhoods in a LA in the most deprived 10% nationally
Source: English indices of deprivation 2019 statistical release
In part these differences in economic outcomes have arisen due to huge changes in the composition of employment across industries over previous decades which have hit places unevenly. The decline of manufacturing has led to jobs being lost in some areas, with the rise of service sector employment occurring in others. In particular, London has attracted a highly educated population wanting to work in high-skill service sector occupations, which in turn can support a substantial lower-wage service sector.
Prosperous cities provide a wide range of amenities and job opportunities, which people are willing to pay high housing costs to access. But this geographic concentration of employment creates huge disparities in access to jobs if people are unable, or unwilling to move, and as seen in the Brexit vote these disparities can manifest in political as well as economic divides.
Geographic impact of COVID19
It seems likely that the economic effects of the pandemic will also vary hugely across different areas of the UK. Around 9 million workers have been furloughed, and looking at the industries in which they work gives an indication of where jobs are at risk, with the top three sectors being retail (1.6 million), accommodation & food services (1.4 million) and manufacturing (0.8 million).
The extent to which these are industries are more prevalent in different areas will have implications for the local impact. The next map shows the % of employees furloughed by local authority. This varies from roughly 15-35%, with high rates in the North, the Midlands and some coastal areas. Areas with the very highest rates include those close to Gatwick and Heathrow and those with the lowest include relatively affluent areas of London and Cambridge.
Differences in % employees furloughed across areas
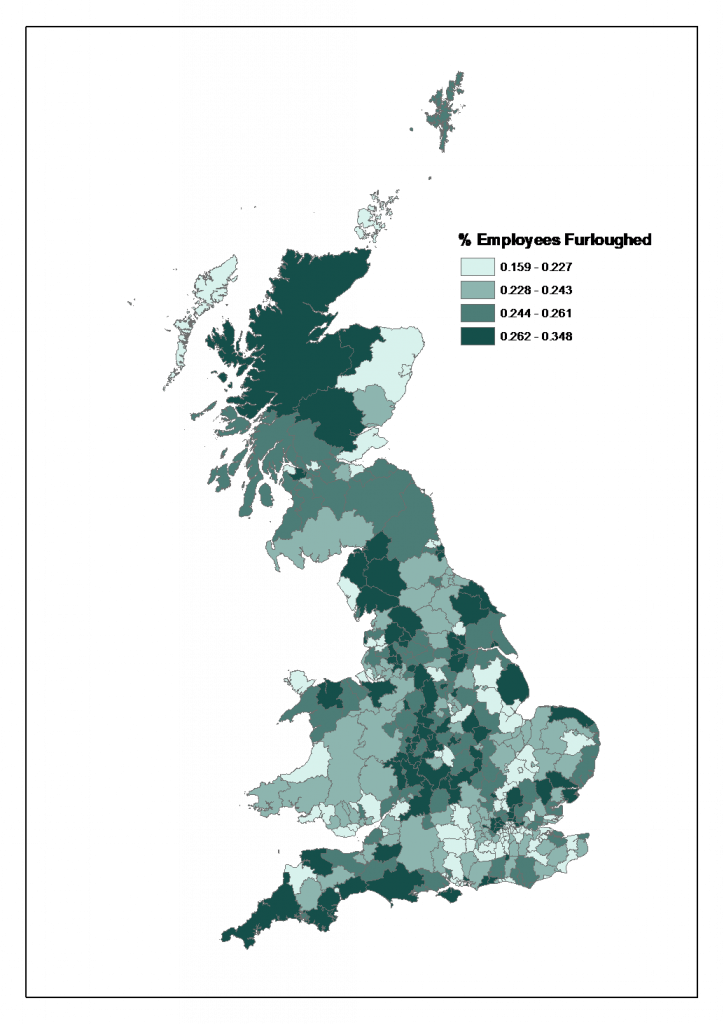
Source: calculations using data from HMRC and ONS
This measure of the furlough rate is higher in more deprived areas, as illustrated in the next figure which plots the % of employees furloughed against a local authority’s deprivation score (with a higher number indicating higher deprivation). It pinpoints two local authorities – Blackpool a coastal area, with the highest deprivation score and Camden in London which has the lowest furlough rate. There is also evidence that a lower percentage of workers have been furloughed in high wage areas. Higher pay occupations lend themselves more easily to working from home so occupation, rather than place, is very likely the driving factor. But because higher-paid occupations are concentrated in certain areas, the impact varies geographically.
More deprived areas had a higher % of employees furloughed
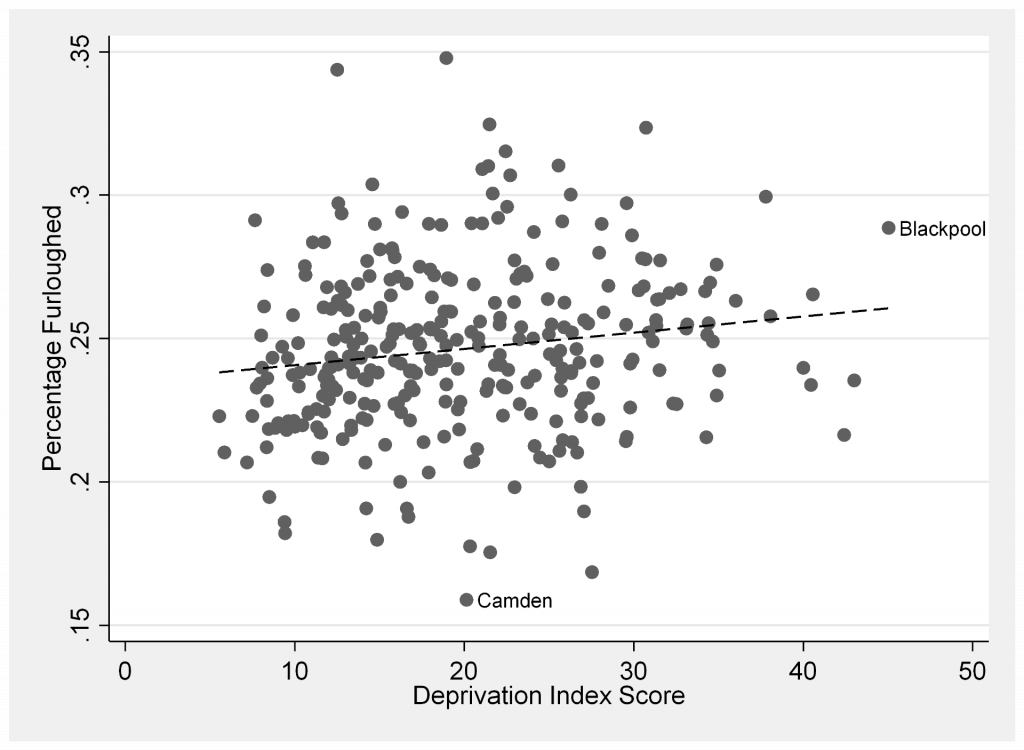
Source: calculations using data from HMRC, ONS and MHCLG
What should the policy response be?
We don’t know yet which industries and which places will be best placed to recover, but history and economic evidence suggests that cities that have performed well in the recent past, such as London, are likely to continue to do so.
One thing we need to know is whether, and how, the pandemic will change behaviour, in terms of residential mobility, commuting versus working from home, changes in online and local spending patterns, and how businesses will structure themselves and their supply chains (although how Brexit negotiations pan out will have a big role to play here).
We can think of policy responses in the short, medium and long term. In the short-term the furlough scheme and support for the self-employed has acted to preserve jobs and businesses. The next stage will be policy aimed at ensuring those who do lose their jobs are enabled to move to new ones, such as access to training and apprenticeships, and the over-arching aim must be policy to address the long-term inequalities in health and educational outcomes this piece began with.
It is not clear that the pandemic has brought about a structural change in the geographic inequalities that already existed. It has certainly highlighted them, and will quite possibly deepen them, but the underlying problems remain the same. Historical ‘place-based’ policies that have aimed to create jobs and raise wages through localised employment subsidies have not made significant inroads to addressing these inequalities.
What appears to be needed now and is in line with the government’s levelling-up agenda to use investment to reduce regional disparities in productivity and earnings, is a reconsideration of how we value public-sector investment and spending in more versus less prosperous locations. We can think of investment in schools, healthcare, transport and housing as place-based policies in themselves, when certain areas are prioritised. This may mean some trade-offs, at least in the short-term, between benefits in aggregate versus at a more local level. But in the longer-term there may be nationwide gains to future generations from less spatial inequality.